
Transit planning software that runs on the feed you already have
Coverage, cost, and Title VI equity analysis in one click—at a fraction of the cost of Remix or Optibus.
No GIS to set up, nothing uploaded anywhere: every number is computed in your browser, straight from your GTFS.
$2,988/yr — about 1/6 the cost of Remix. Small enough for a P-card, no RFP.
26 published feeds and counting · Built by an AICP transit planner
Watch the 50-second demo: Title VI in one click, live cost estimates, and side-by-side service alternatives.
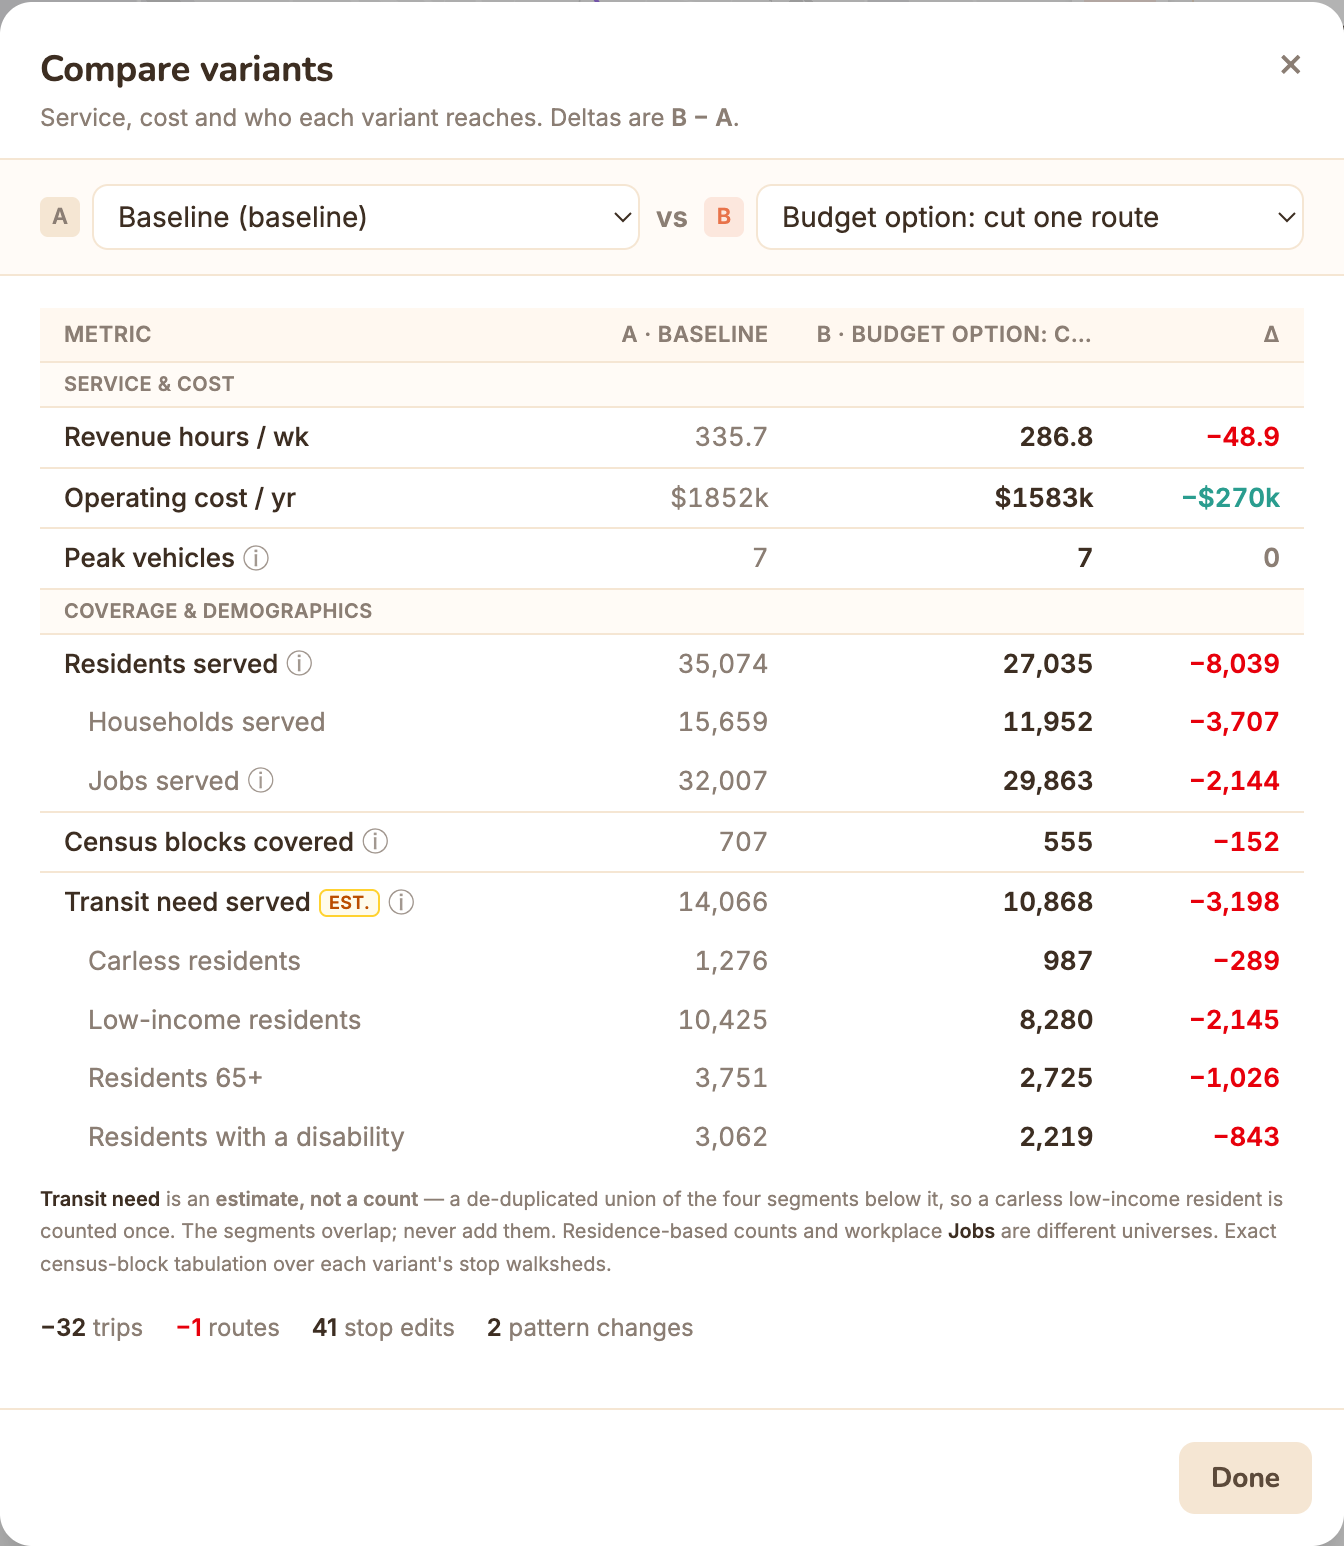
Compare service scenarios side by side
Sketch a service change as a variant of your feed—your baseline stays untouched—then put any two scenarios next to each other in one table with per-metric deltas: weekly revenue hours, annual operating cost, peak vehicles, then residents, households, and jobs served, census blocks covered, and transit need, including carless, low-income, senior, and disabled residents. Pick the alternative that wins on cost or on equity, and bring the table to the board meeting.
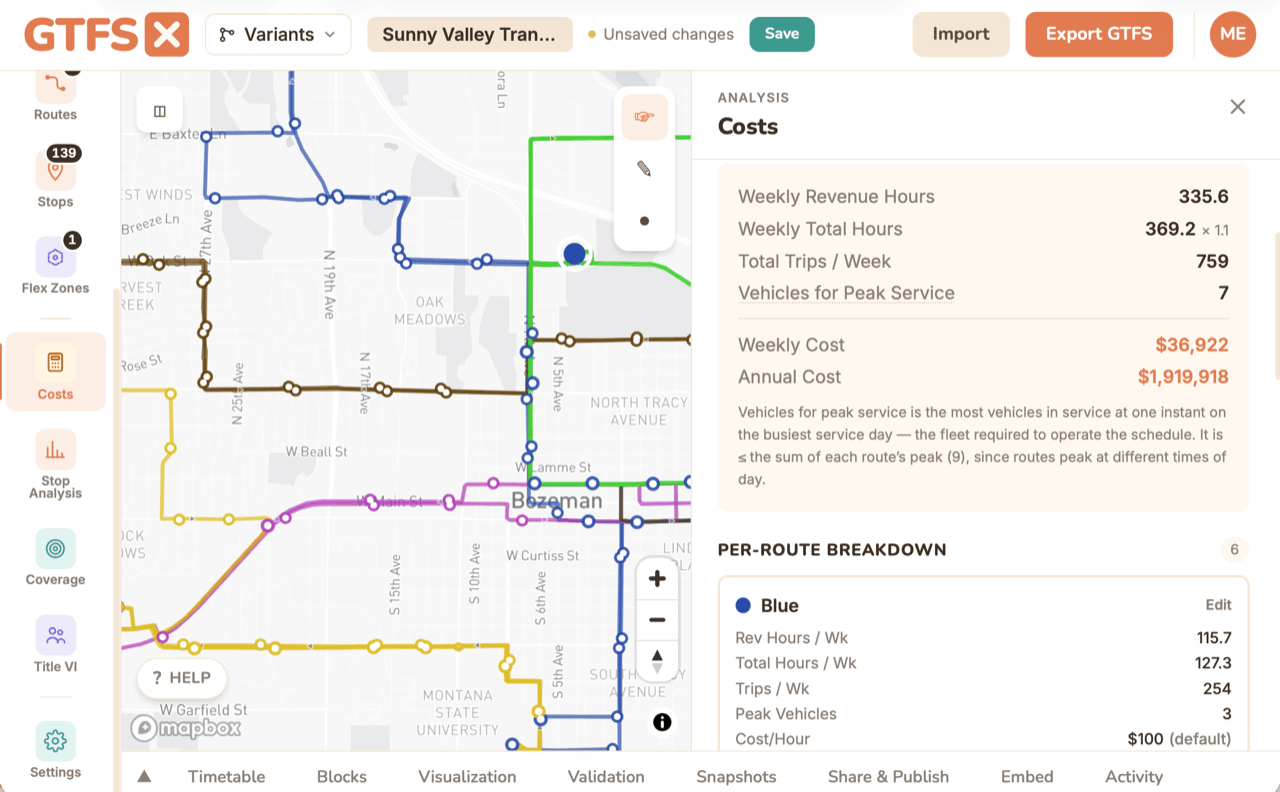
Operating cost estimates
Answer "what does this service cost?" directly from the schedule. GTFS·X reads every revenue hour in the feed, computes the peak vehicle count, and multiplies by a cost-per-revenue-hour you control: per-route and system-wide weekly and annual figures, with one-click CSV export. Set your own loaded labor rate (NTD operating expense per vehicle-revenue-hour is a defensible starting point) and a deadhead factor for platform time. Compare a proposed alternative against today's service with a saved snapshot.
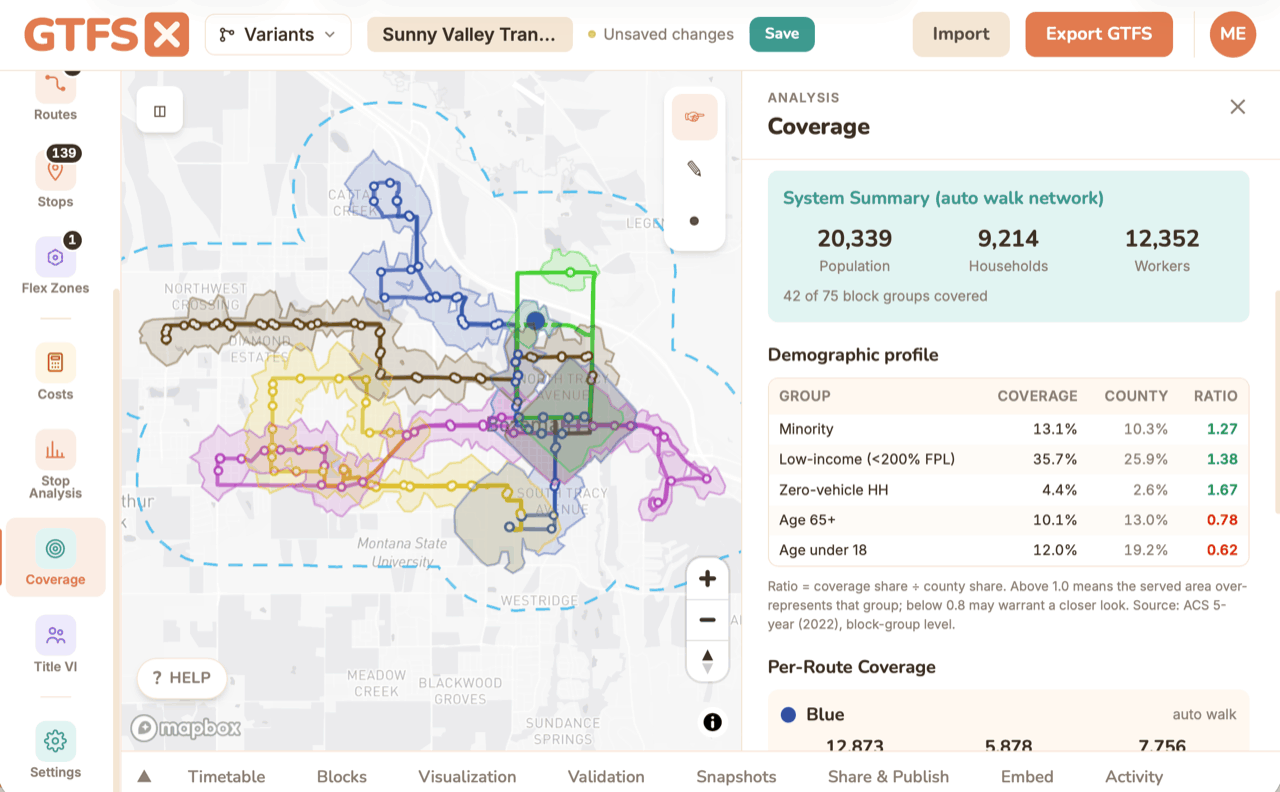
Demographic coverage
Population, households, and workers within walking distance of your stops, from US Census ACS five-year data, apportioned by buffering each stop (quarter-mile bus, half-mile rail) and overlapping the Census block groups it touches. Per-route and system-wide totals, the kind of number FTA discretionary programs ask for.
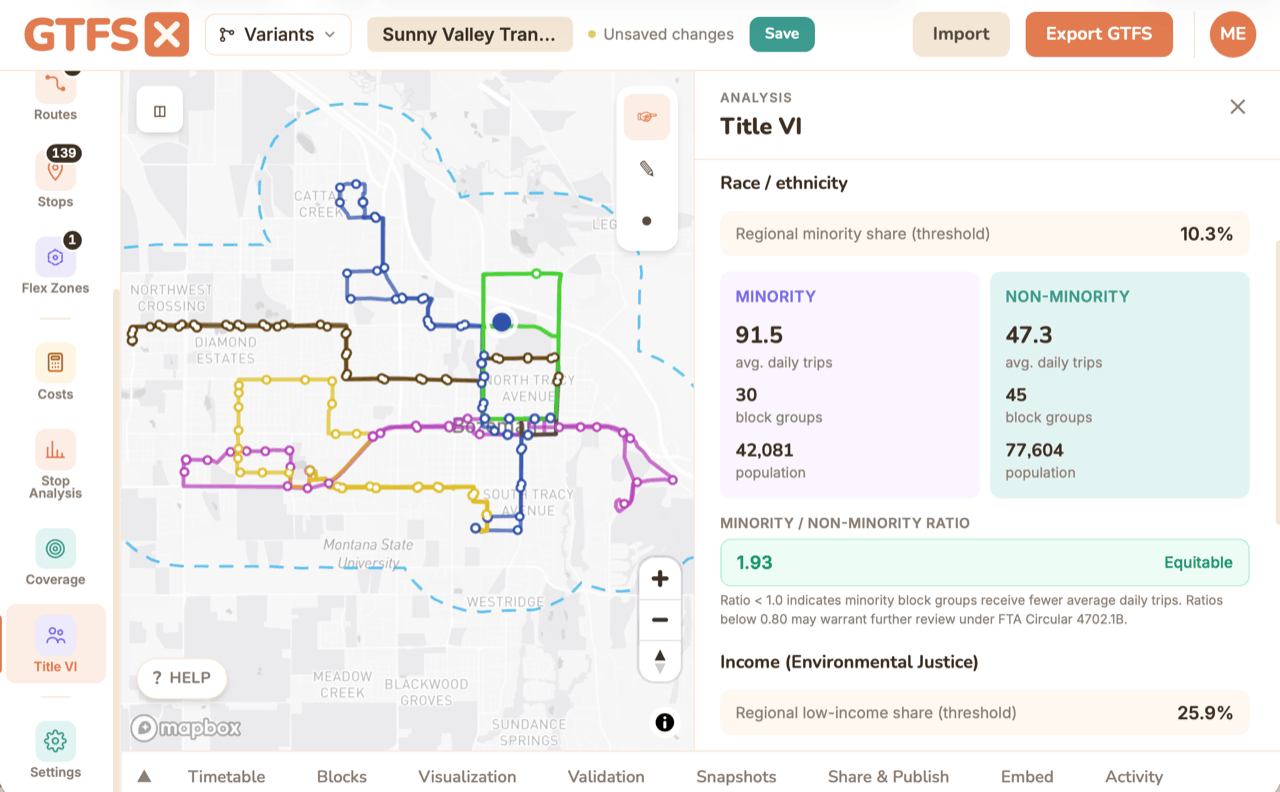
Title VI equity analysis
Run an equity check while you're still designing the change. GTFS·X compares trips-per-capita in minority vs non-minority block groups (ACS B03002) and reports an equity ratio against the four-fifths (0.80) convention from FTA Circular 4702.1B, with green/amber/red banding. Run it on the current feed and the proposed feed and compare.
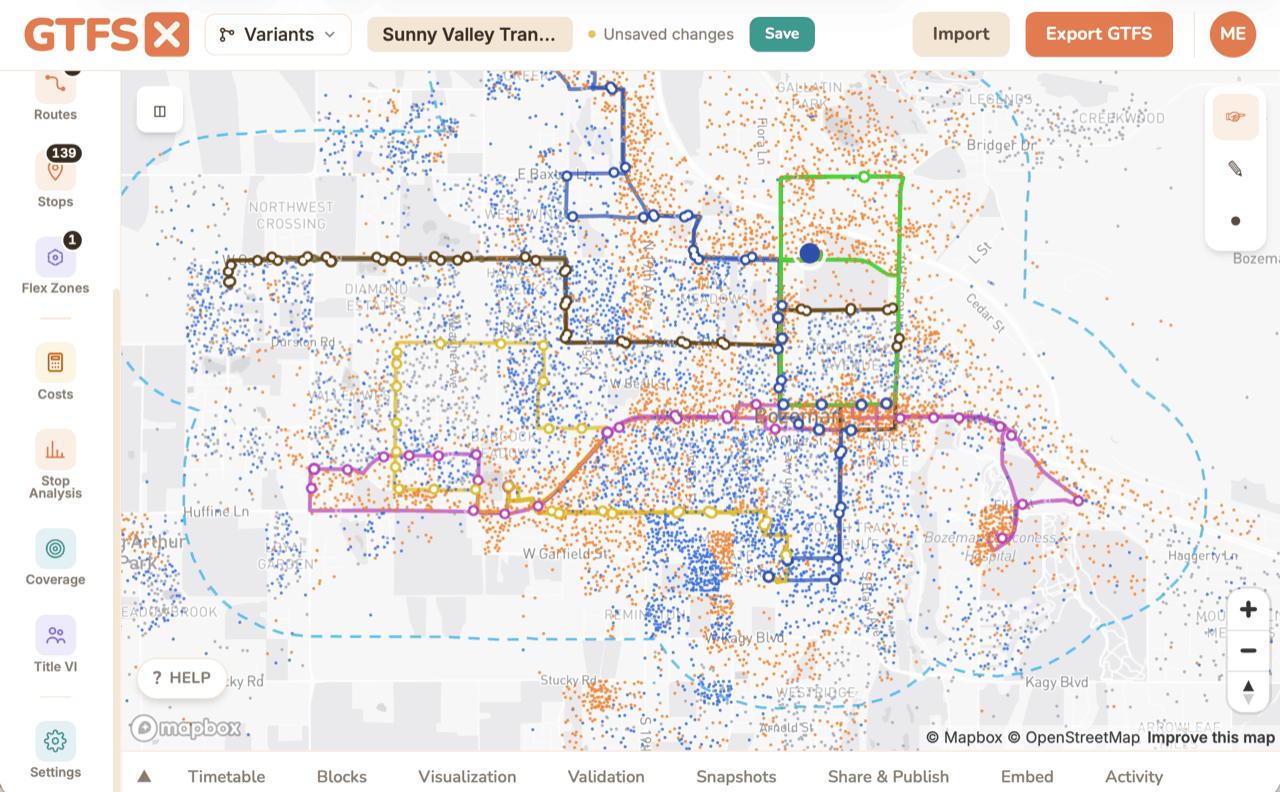
Rider propensity: Demand Dots Free
A nationwide map layer showing where transit demand concentrates: blue dots for high-propensity adults (renters, zero-vehicle households, ages 18–24), orange dots for jobs (LEHD LODES), one dot per five people or jobs. Toggle it on while sketching an alignment or sizing a flex zone. Free on every plan.
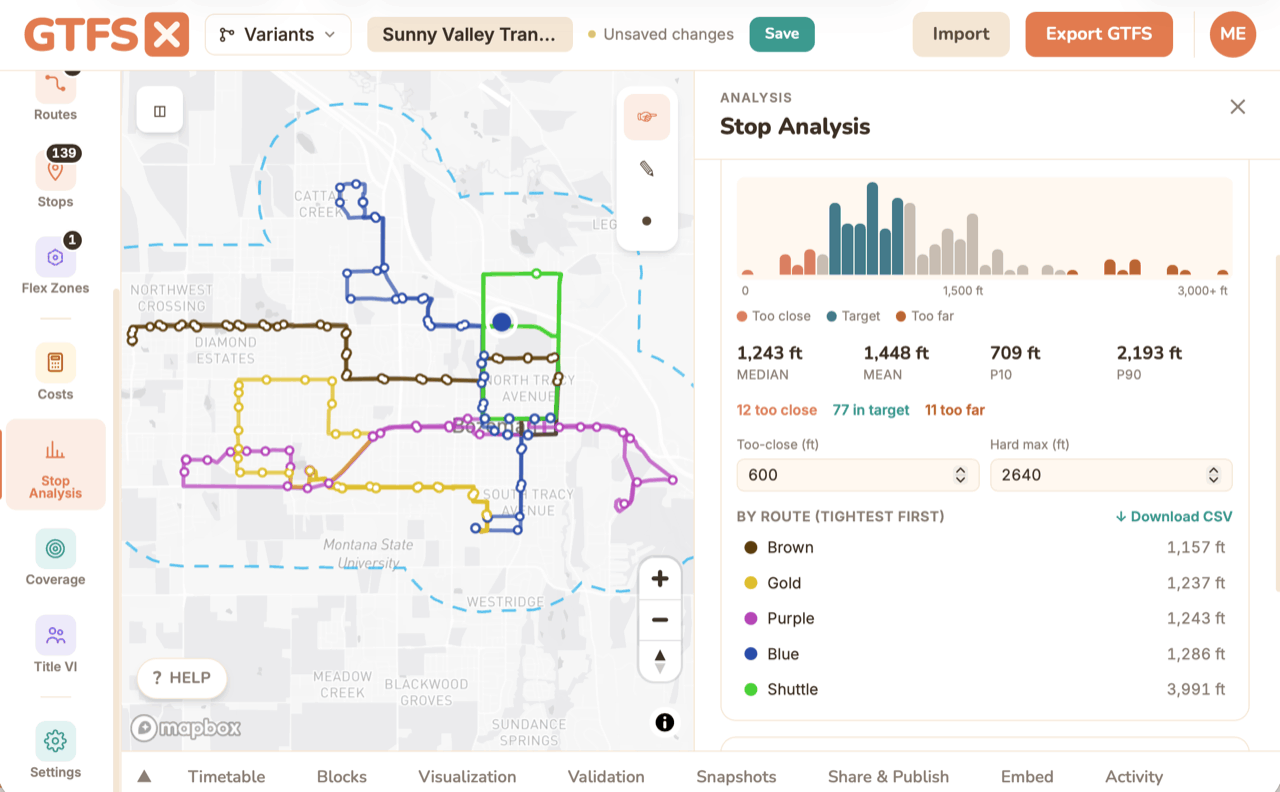
Stop analysis
Four stop-level diagnostics most agencies never pull from their feed: stop-spacing distribution (against APTA / TransitWiki benchmarks), consolidation candidates with a time-saving estimate each, service intensity per stop, and wheelchair-accessibility completeness. Every table exports to CSV; findings highlight on the map.
Defensible by design
Built for planners who have to defend a number: real Census vintages cited on every result (ACS 2022 5-year for coverage/Title VI; ACS 2020–2024 + LEHD LODES 2023 for Demand Dots); standards not guesses (FTA Circular 4702.1B four-fifths, conventional walk buffers, APTA stop spacing, NTD cost reference); and documentation that states plainly what each tool doesn't capture.
The planning suite, without the enterprise price tag
GTFS·X Planner is $2,988 a year: route-level cost and coverage, Title VI, and stop analysis, computed next to the feed you already edit, for roughly a sixth of what a dedicated planning platform runs.
Free on every plan: the Demand Dots layer, the Service Summary (revenue hours, trips, peak vehicles, span), and the system-level headline figures for cost and coverage.
Planner: route-level cost and coverage depth, Title VI, stop analysis, hosted publishing, and team collaboration.
| GTFS·X Planner | Remix | Optibus | Trillium | |
|---|---|---|---|---|
| Annual cost | $2,988 | $20,000+ | $25,000+ | $5,000-10,000+ |
| Route planning | ✓ | ✓ | ✓ | (managed) |
| Demographics | ✓ | ✓ | ✓ | — |
| Title VI | ✓ | ✓ | partial | — |
| Self-serve | ✓ | ✓ | ✓ | — |
GTFS·X Planner
- Route planning ✓
- Demographics ✓
- Title VI ✓
- Self-serve ✓
Remix
- Route planning ✓
- Demographics ✓
- Title VI ✓
- Self-serve ✓
Optibus
- Route planning ✓
- Demographics ✓
- Title VI: partial
- Self-serve ✓
Trillium
- Route planning: managed
- Demographics: —
- Title VI: —
- Self-serve: —
Pricing estimates as of 2026. See /compare/remix/ and /compare/trillium/ for honest side-by-side comparisons.
Questions planners ask
How does GTFS·X Planner compare to Remix?
Can I try the Planner features without signing up?
What's included in the Planner plan?
Do you offer professional services?
What about FTA reporting requirements?
What if we outgrow Planner?
Plan your next service change from the feed you already have.
26 published feeds and counting · Built by an AICP transit planner