
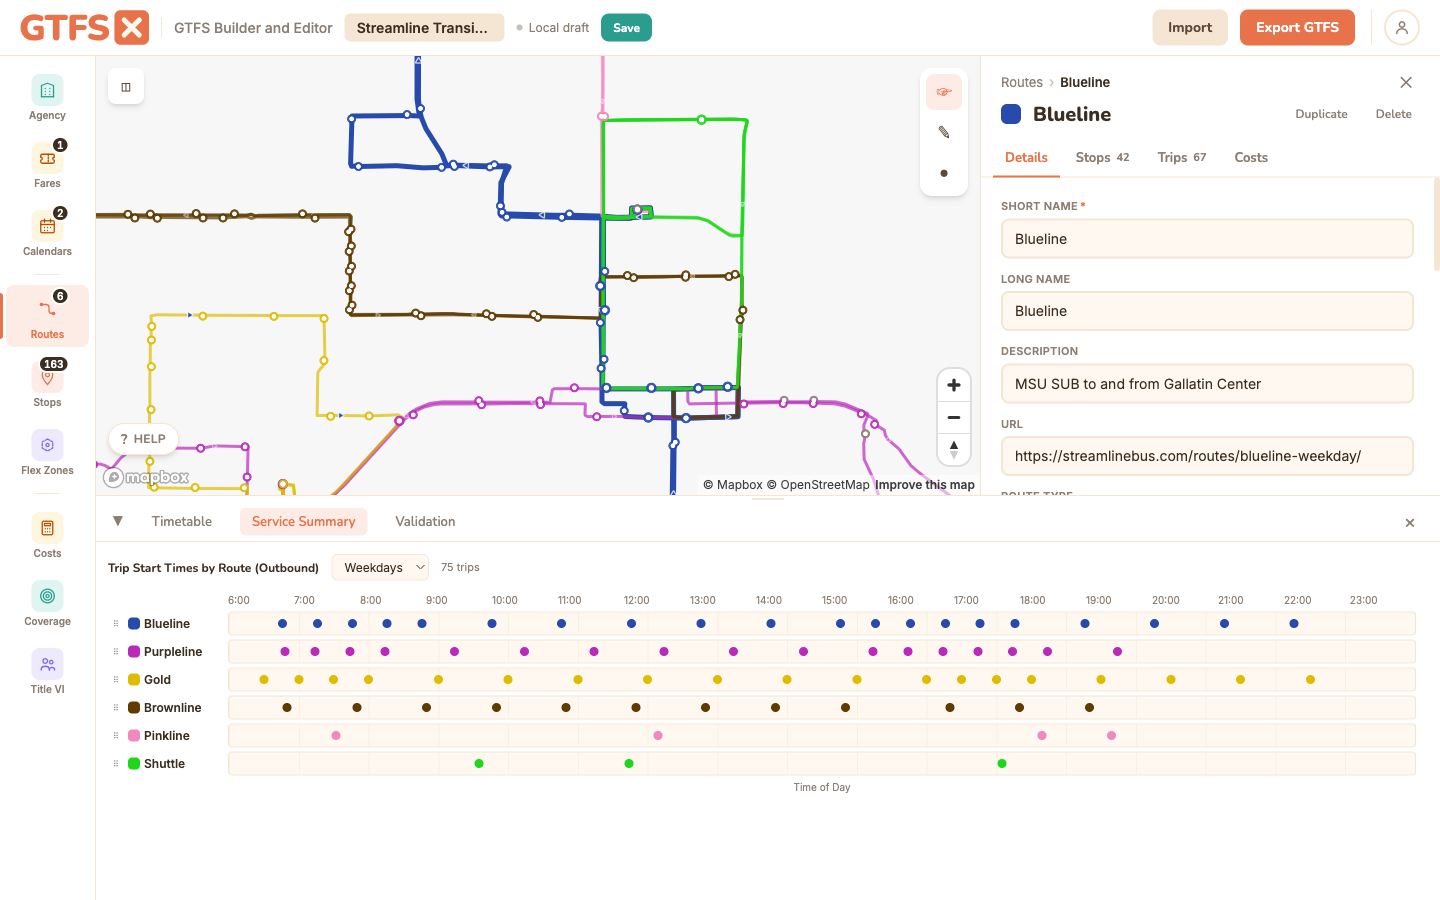
Docs · Validation & I/O · Service summary
Service summary
The Service Summary tab surfaces the operational shape of your feed as numbers: weekly revenue hours, total trips per route, peak vehicle count, and span of service. Use it to sanity-check a feed before publishing, prep NTD reporting figures, or compare a proposed alternative against the existing service.
What it shows
Open the Service Summary tab in the footer. The view is organized by route, with a system-wide summary at the top.
- Weekly revenue hours — sum of trip durations across all trips on each calendar day in a typical week, multiplied by how often each calendar runs.
- Trips per week — count of distinct trips operating in a typical week, summed across service patterns.
- Peak vehicles — the maximum number of vehicles required at any moment. Computed via a sweep-line over trip start/end times.
- Span of service — earliest first-stop departure and latest last-stop arrival across the route's trips.
- Service days — which days of the week the route runs on, derived from the calendar pattern of every trip.
When to use it
- Sanity-check a freshly built feed. Does the revenue-hour total match what the agency budget says you operate? A 30% divergence usually means the feed has stale trips or a calendar that's wrong.
- Prep NTD reporting figures. Service hours and miles are part of the NTD F-30 / S-10 forms. The Service Summary gives a defensible figure — verify against the operator's farebox or AVL data before submission.
- Compare alternatives. Author two feeds (current vs. proposed) as separate projects, open Service Summary on each, and put the per-route numbers side by side in a board memo. Often more legible than a cost figure alone.
- Spot anomalies. A route with 200% the trip count of a peer suggests duplicated trips. A route with 4 hours of span when the timetable says 14 suggests a service pattern that's only running one day per week. Service Summary makes anomalies obvious.
Methodology
- Revenue hours per trip = last stop time − first stop time. Includes layover at terminals if those stops are in
stop_times.txt. - Weekly = per-service-day revenue hours × number of days that service runs in a typical week (the seven day toggles in
calendar.txt, ignoring exceptions for the weekly average). - Peak vehicles via sweep-line: walk start and end times in chronological order, count overlapping trips, take the max. This is the lower-bound peak — actual fleet size is a bit higher due to pull-out / pull-in time and the operator's interlining choices.
- Service days derived from the calendar patterns referenced by the route's trips. A route with trips on both a Weekday and Saturday service shows as "Mon–Sat".
Edge cases and gotchas
- Frequency-based trips are expanded against the headway. A 10-minute headway over 14 hours contributes 84 trips and the corresponding revenue hours, even though it's one row in
frequencies.txt. - Calendar_dates exceptions don't affect the weekly figure. The summary uses the weekly pattern in
calendar.txt; holiday adds/removes affect the annualized total separately (used by Cost estimation) but not the "weekly" figure. - Revenue hours include scheduled layover. If the published
stop_timesinclude a 20-minute layover at the terminal, that's in the revenue-hour total. Operationally that's correct — the bus is on the route — but it's not "in service" in the way a rider would describe. - Doesn't include deadhead. Pull-out, pull-in, and reposition moves aren't in GTFS. Cost estimates apply a deadhead factor; the raw revenue-hour figure here is service hours only.
See also
- Cost estimation — adds a per-revenue-hour cost on top of the figures shown here.
- Timetables & trips — the underlying trip data.
- Service calendars — what drives the weekly multiplier.