New: Transit Access Isochrones (Agency plan)
We just shipped Transit Access Isochrones, a new analysis tool on the Agency plan.
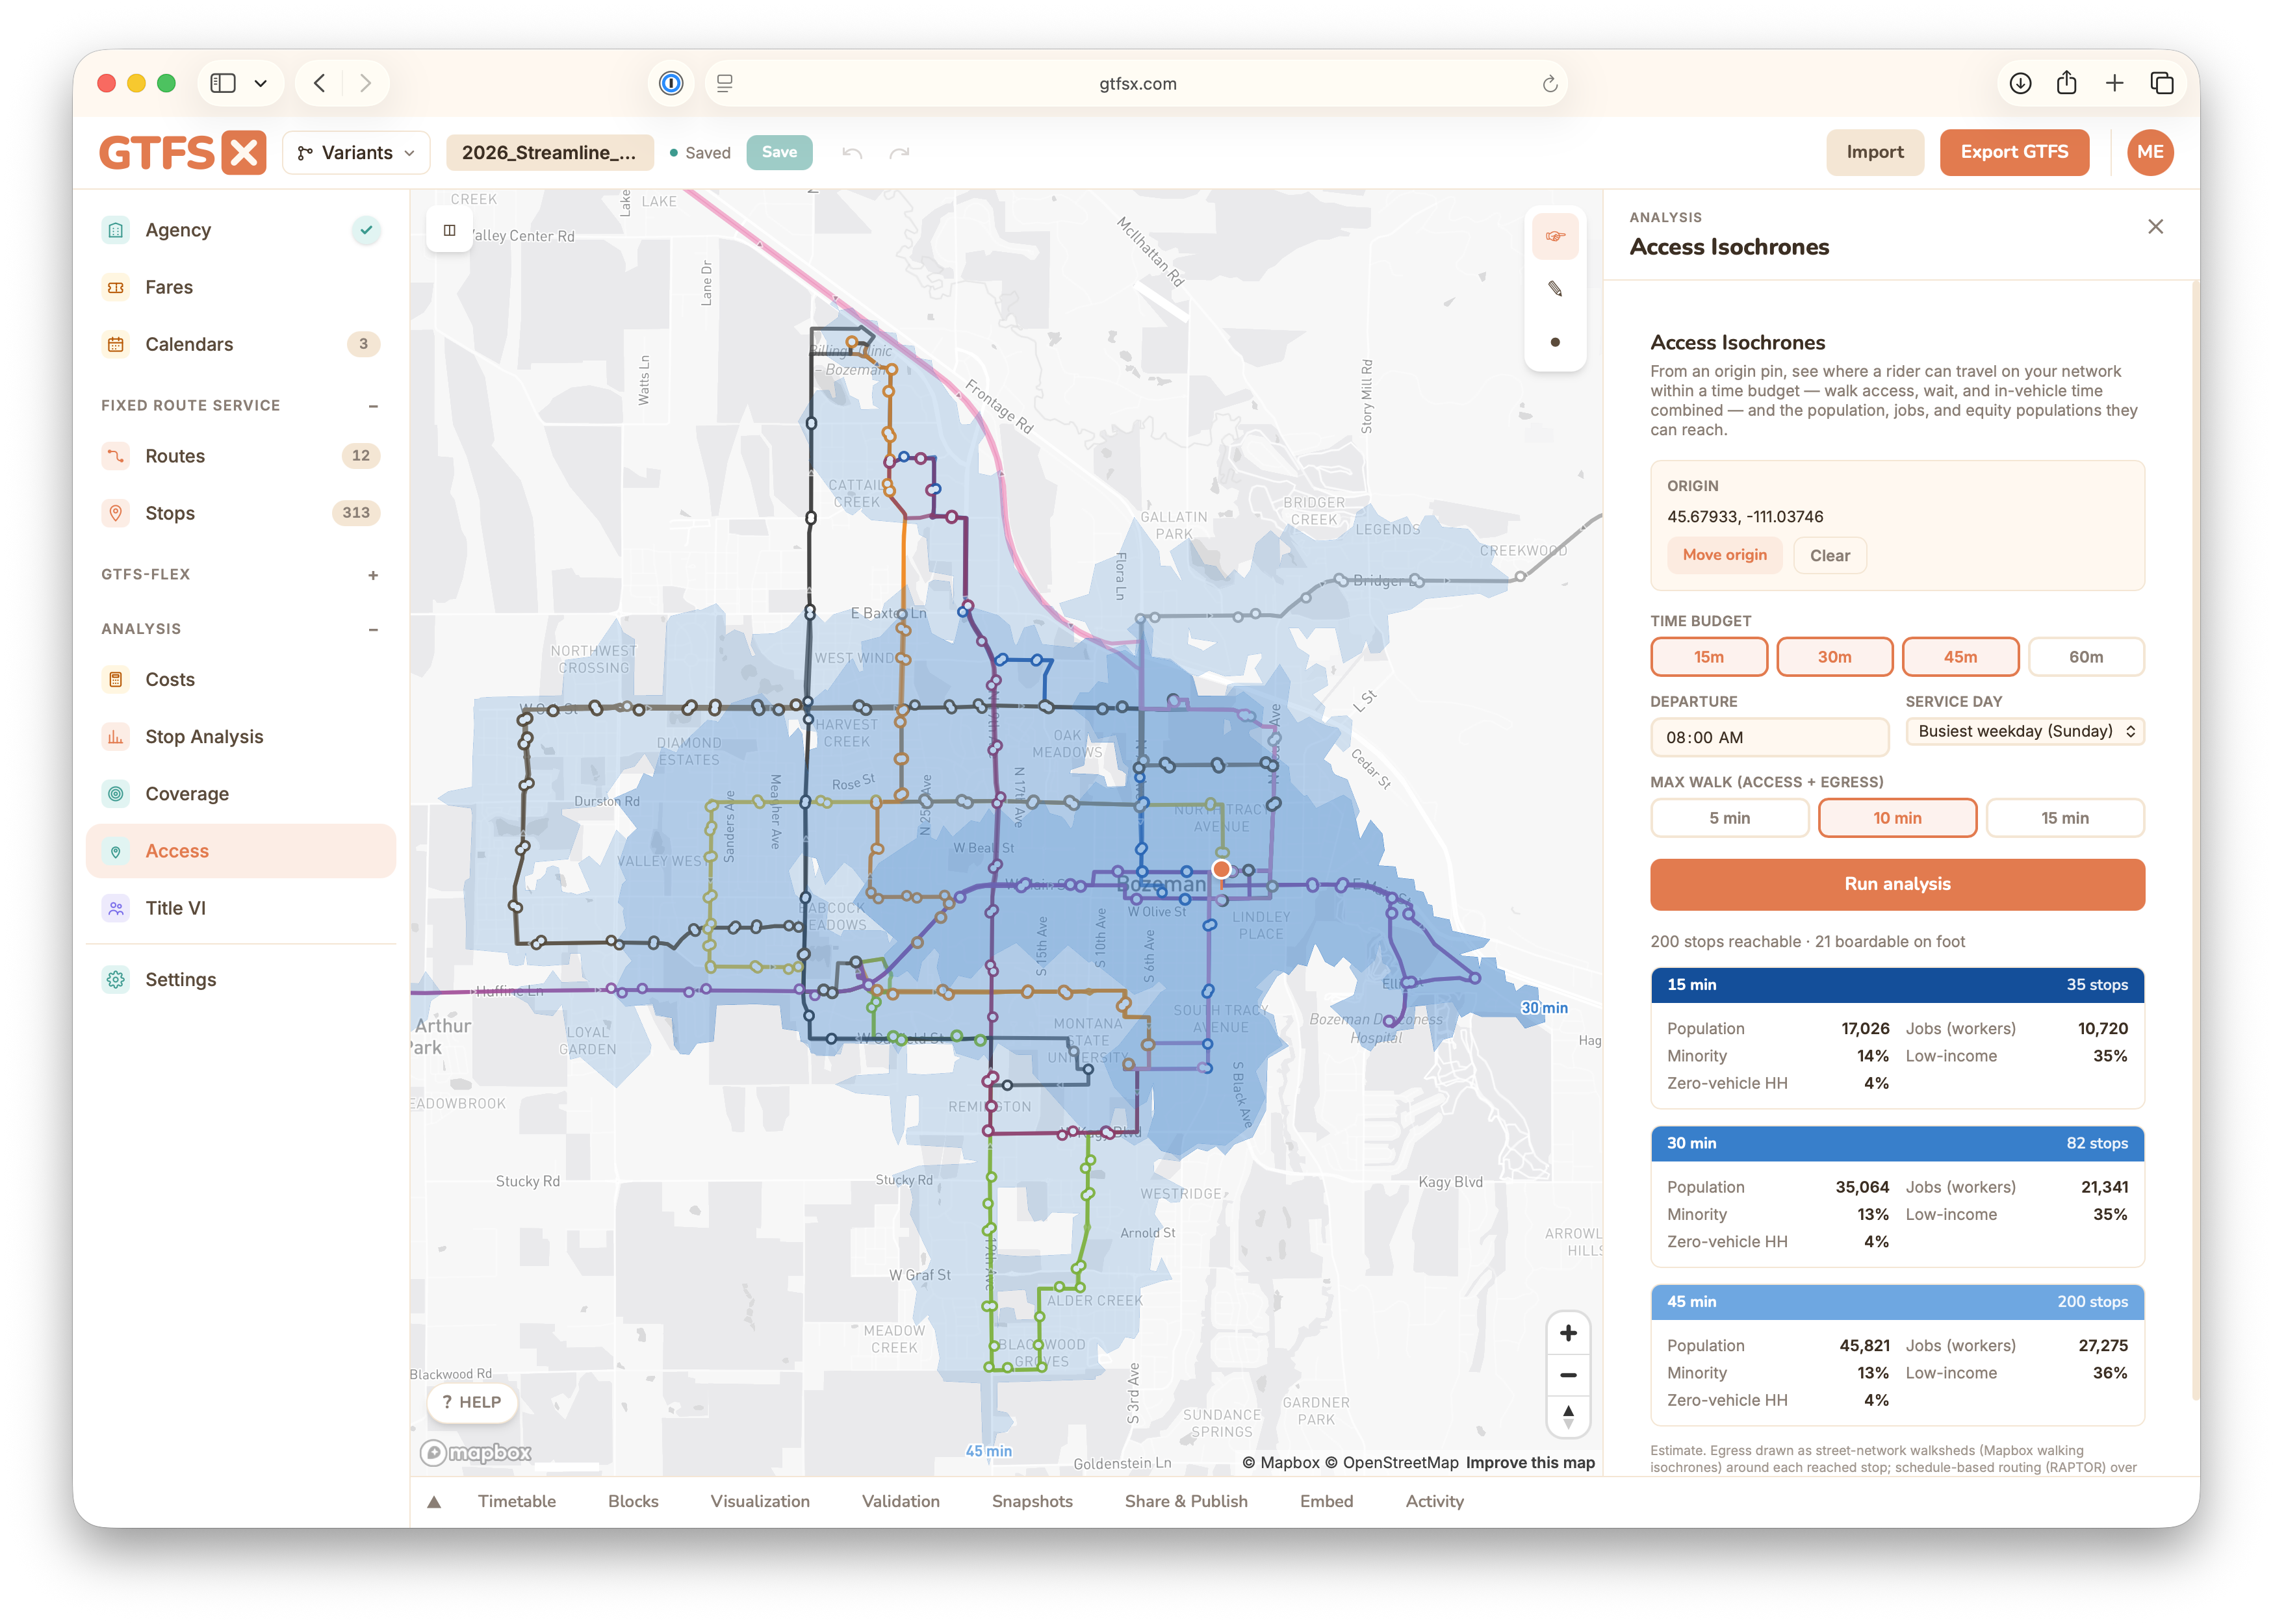
Drop a pin anywhere on the map and see where a rider can travel on your network within a time budget. It combines the walk to a stop, the wait for service, the in-vehicle ride, transfers, and the walk from the final stop into one reachable area, drawn as nested time contours.
What you get
- Time-budget contours on the map (15 / 30 / 45 / 60 min), with the walking legs following the real street network.
- The population, jobs, and equity populations (minority, low-income, zero-vehicle households) reachable inside each contour.
- Controls for departure time, service day, and maximum walk distance.
Where to find it
Open a feed in the editor and click Access under Analysis in the left sidebar. Set an origin, pick your time budgets, and hit Run.
How it works
It runs a schedule-based RAPTOR router over your feed, then draws routed street-network walksheds around every reachable stop. Full write-up in the docs: https://www.gtfsx.com/docs/access-isochrones/
This answers the question coverage analysis can't: not just who lives near your stops, but where your service actually lets riders go. Useful for grant narratives, equity analysis, and comparing a proposed network change.
As always, feedback welcome.