
Service planning Agency
GTFS·X is a feed editor that now does light service planning too: enter a headway and get a timetable, fork the feed into variants and compare what each one costs, chain trips onto vehicles, and set running times. The scheduling tools open in the map's pane, so you plan and edit in the same window.
These tools are built for small and rural agencies. They stay deliberately simple and fully editable: there is no optimizer and no runcutting. The generated timetable and the auto-blocking are starting points you adjust, not black-box answers.
The scheduling views
A small switcher sits at the top of the map pane with three modes: Map, Timetable, and Blocks. The map stays loaded behind the scheduling views, so switching back to it is instant and keeps your camera position. Pick a route and service day inside each view.
Generate a timetable
Drawing a route gives you a shape and stops, but no trips. Rather than hand-entering every departure, open the Timetable view and use Generate service. Set a window (say 06:00 to 22:00), a headway ("a bus every 30 min"), and an end-to-end run time, and GTFS·X lays out evenly-spaced trips for you. A live count ("Creates 33 trips") updates as you type.
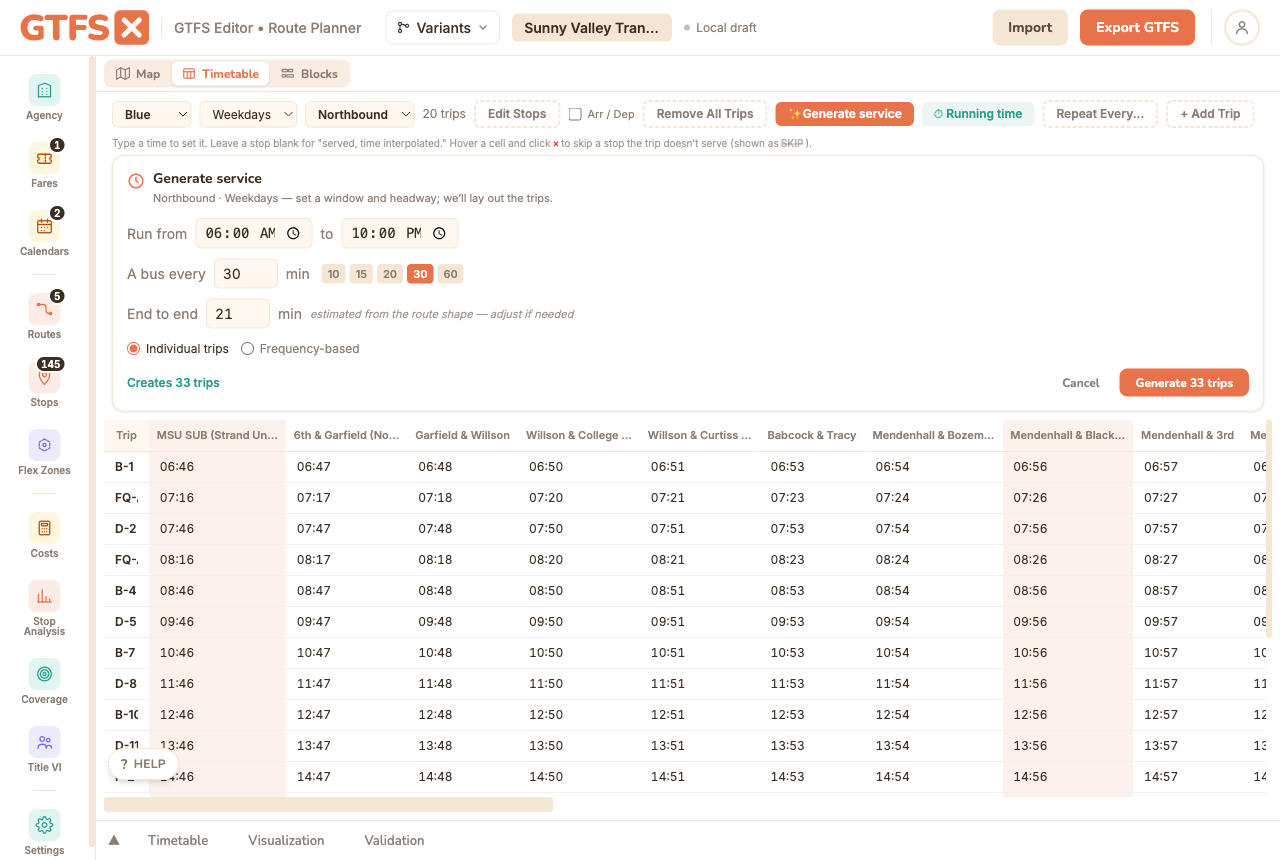
The run time is interpolated across intermediate stops by shape distance, and the first and last stops become timed points. The result is ordinary trips and stop_times you can edit by hand in the grid, copy by service day, or re-time later. Prefer a compact, headway-based feed? Switch the form to Frequency-based and it writes one reference trip plus a frequencies.txt window instead of individual trips.
Set running times
Once trips exist, Running time (in the timetable toolbar) sets the scheduled end-to-end run time for the whole pattern. Apply it and every trip on the pattern is re-timed to match, while each trip keeps its own start time, so your headways stay exactly as they were. Intermediate stops are re-interpolated. This is the quick way to push a realistic running time through a generated timetable, or to stretch the schedule for a season with heavier traffic.
Block trips onto vehicles
The Blocks view is a vehicle-by-time chart: one row per vehicle (block), trip bars colored by route, the gaps between them labeled as layover, and dotted connectors where a vehicle deadheads between two stops. Columns on the left show each block's platform hours and its pull-out and pull-in times.
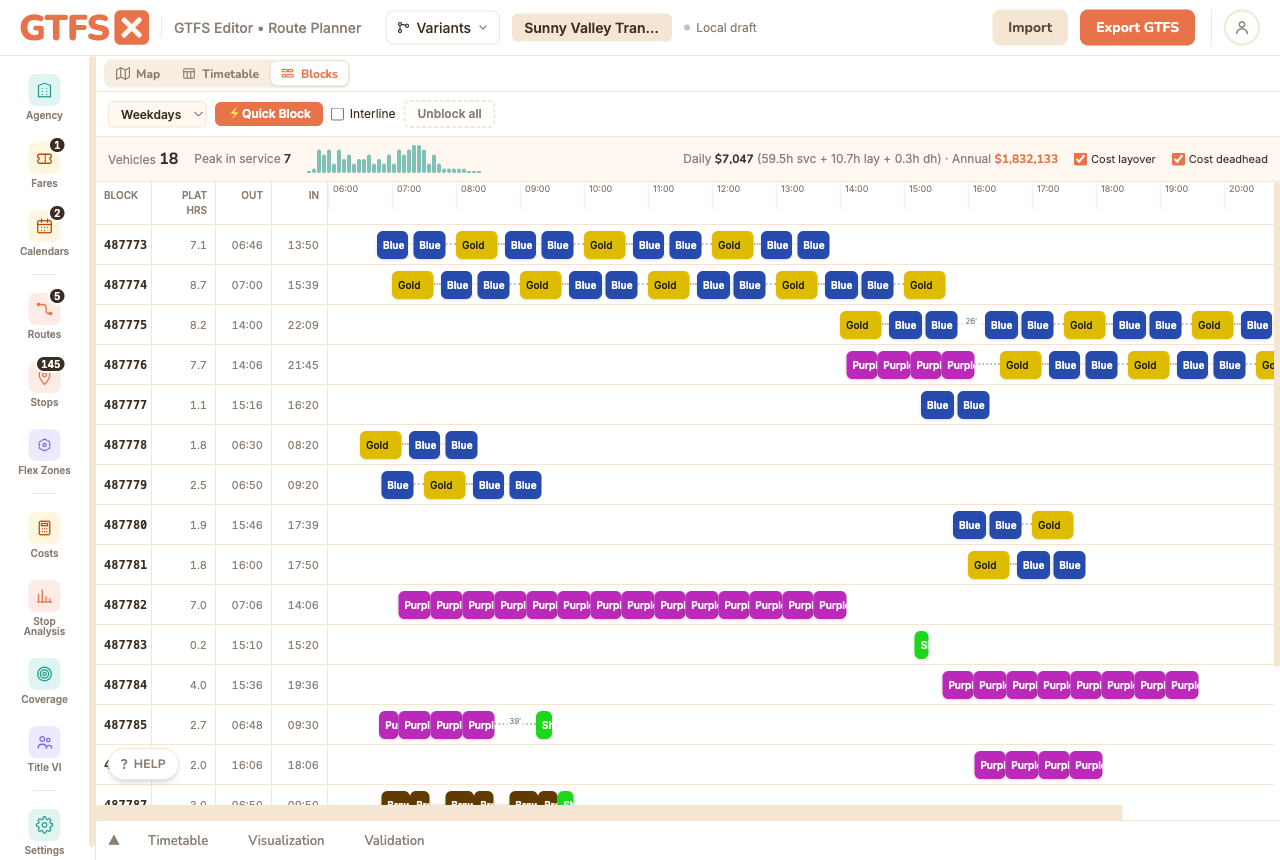
Quick Block auto-chains feasible trips onto as few vehicles as possible with a transparent greedy rule: it appends each trip to the earliest-finishing vehicle that can still reach the trip's start in time and without sitting idle too long, opening a new vehicle only when none fits. Turn on Interline to allow chaining across different routes; leave it off to keep each vehicle on one route. Unblock all clears the day. Everything Quick Block produces is editable: drag a trip bar onto another vehicle (or click it and pick one) to reassign it. If two trips on the same vehicle would overlap, GTFS·X flags them in red and counts them in the toolbar, because one bus can't run two trips at once.
The cost header upgrades the flat deadhead multiplier used elsewhere to real, block-derived numbers: service hours from the trips, layover hours from the in-block gaps, and deadhead hours from the distance a vehicle repositions between trips. Toggle Cost layover and Cost deadhead to see how each affects the total. Block overlaps also surface as a warning in the pre-publish validation, so an infeasible block can't slip into a published feed.
Variants and baseline comparison
Service planning is comparative. You rarely ask "what does this network cost?" in isolation; you ask "what does this change cost versus today?". Variants let you answer that without keeping two copies of the feed. Fork the feed into a named variant from the header, edit it freely (add a Saturday span, cut a route, re-time a pattern), then compare it to the baseline.
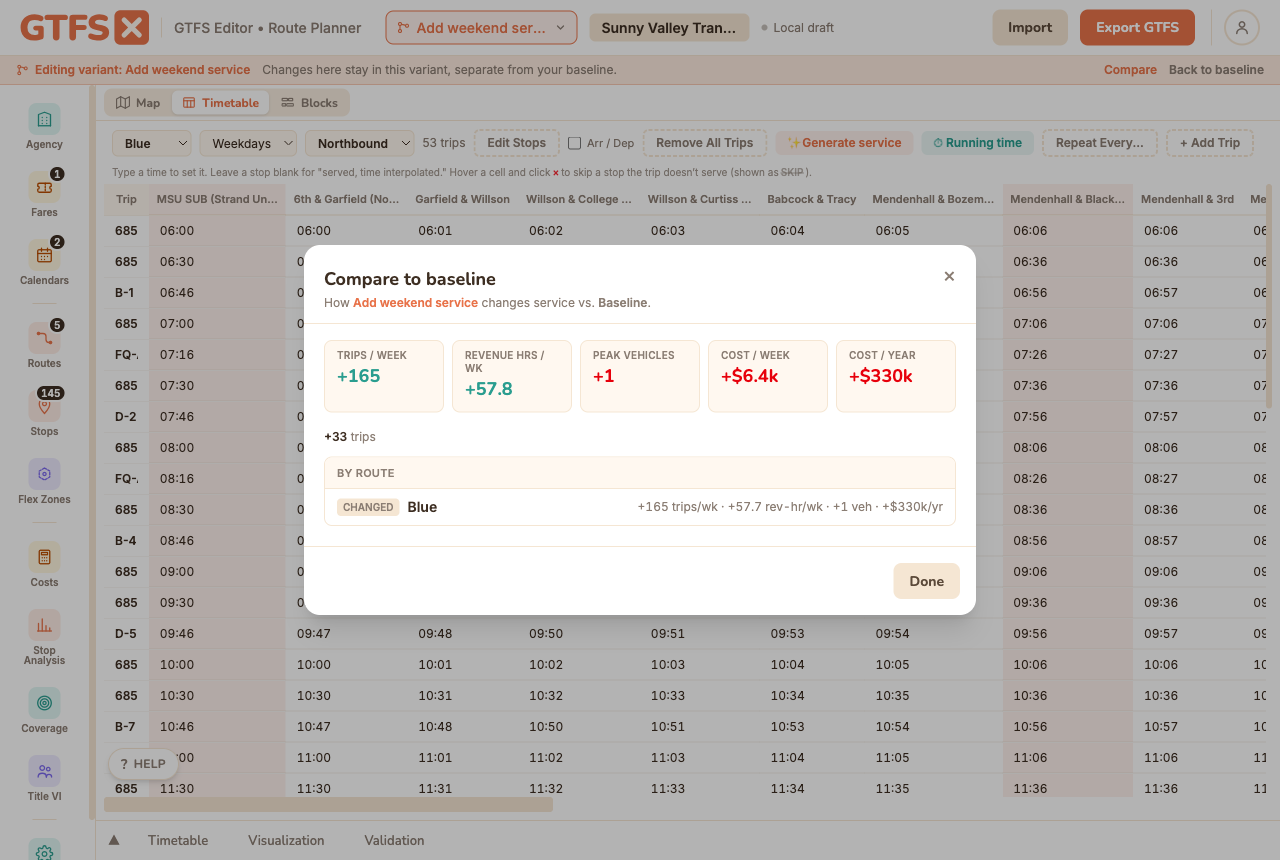
The comparison shows a delta strip (change in weekly trips, revenue hours, peak vehicles, and weekly and annual cost) plus a per-route changeset like "Route 5: +12 trips/week, +$48k/yr". A banner reminds you while you're editing a variant that your changes are separate from the baseline, and one click switches back. Variants are an exploration layer that lives in your session; they don't change your saved feed unless you choose to keep one.
Variants are distinct from route visibility, which only hides and shows existing routes to scope the analysis panels. Variants carry real, independent edits and a computed cost comparison.
What this is not
This is good-enough planning for a small agency, not an optimization suite. There is no solver: generated headways are even, Quick Block is a greedy heuristic you edit, and running times are entered by hand (no AVL). Crew scheduling and runcutting are out of scope. If you need those, GTFS·X hands a clean, valid feed to the tool that does.
See also
- Timetables & trips — the grid the generated trips land in, plus blocks as a trip column.
- Cost estimation — the per-route cost model the comparison and the block cost build on.
- Route visibility — hide and show routes to scope the analysis panels to a subset of the network.
- Service summary — peak vehicles and revenue hours across the feed.