
Cost estimation Agency
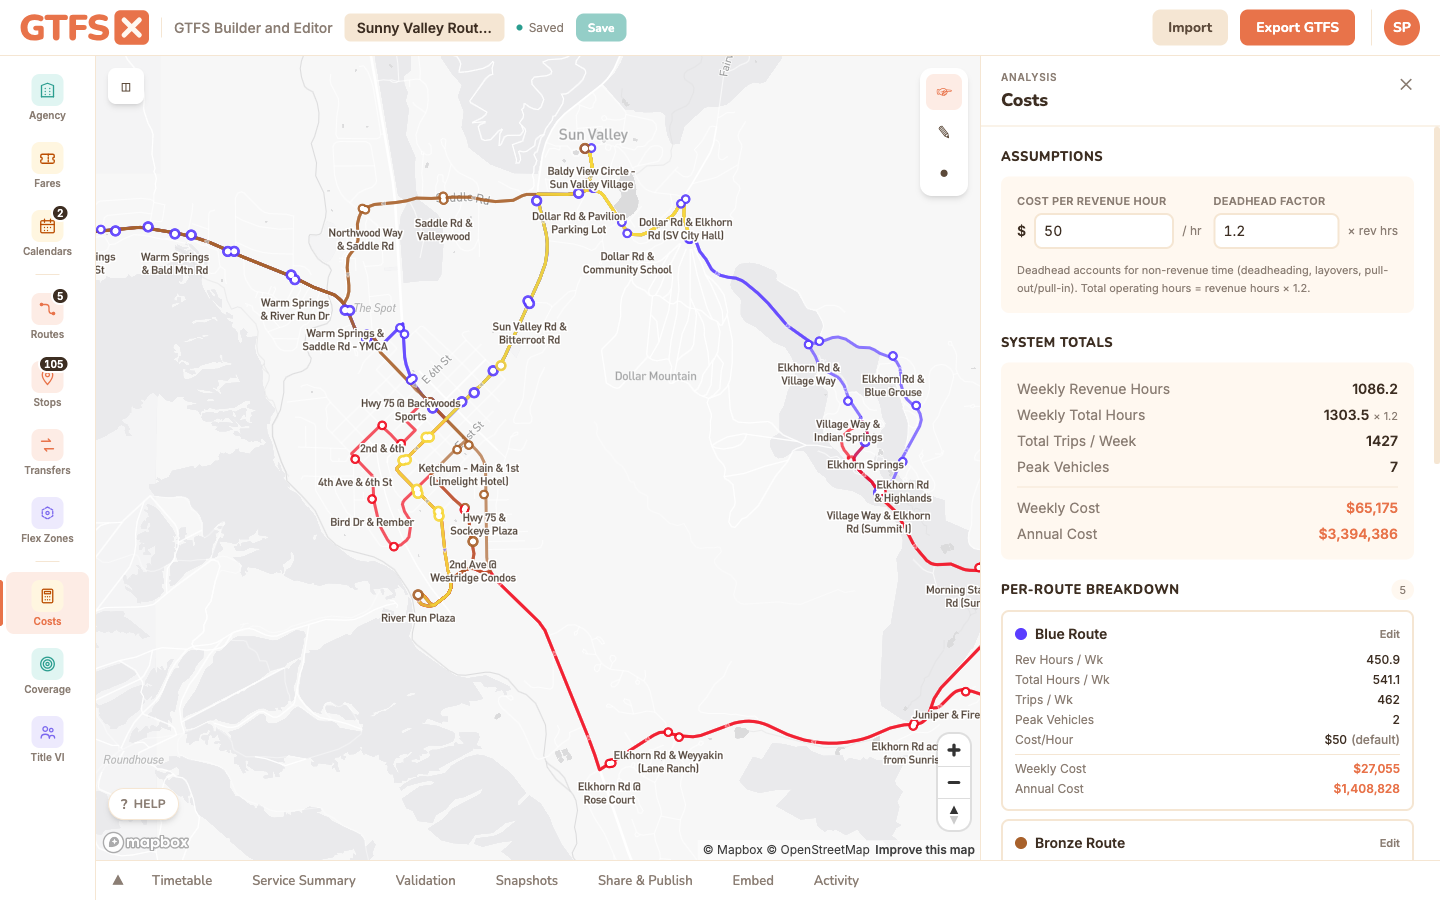
Estimate the operating cost of any GTFS feed — existing service, a proposed alternative, a back-of-envelope sketch — using revenue hours pulled from the trip schedule and a configurable cost-per-revenue-hour. Outputs per-route and system-wide weekly and annual figures, plus the peak vehicle count.
System-level totals are free on every plan. The per-route breakdown and CSV export are an Agency feature.
What it is
For most small and mid-size agencies, "what does this service cost?" gets answered with a spreadsheet someone built once and nobody fully trusts. The Costs panel replaces the spreadsheet with a calculation that reads the feed directly: every revenue hour in the schedule, the peak vehicle count required to operate it, multiplied by a cost-per-revenue-hour you control. It runs in the editor with no setup, recomputes as you edit, and lets you compare an existing service against a proposed change side by side by saving a snapshot.
The output is a budget figure suitable for a board memo, a grant narrative, a service-planning workshop, or a back-of-envelope sanity check — not a substitute for the operator's own cost model, which has to account for benefits, fuel, maintenance, garage capacity, and a hundred other things that don't live in a GTFS feed.
When to use it
- Comparing two alternatives for the same corridor: does the limited-stop variant cost more or less than the local?
- Sizing a proposed extension before going to the board (or to a grant writer) with a number.
- Sanity-checking an existing service against the agency's published budget — large divergence is usually a sign that the GTFS feed is out of date.
- Estimating peak vehicle count for a fleet-planning discussion (the panel computes this from trip overlaps, which is harder to do by hand than it sounds).
How to use it in GTFS·X
- Open the feed in the editor and click Costs in the left sidebar. The panel opens on the right.
- Set the Cost per Revenue Hour input. The default is $50, which is a placeholder, not a recommendation — every agency should plug in its own loaded labor rate (typically $80–$180/hour for fixed-route bus, depending on geography and the operating model). NTD's per-mode operating expense per vehicle-revenue-hour is a defensible starting point if you don't have an internal number; see "Methodology references" below.
- Set the Deadhead Factor input. This is the multiplier on revenue hours to estimate total platform hours (revenue hours + pull-out, pull-in, layover, and reposition time). The default is 1.2 — usable for most urban fixed-route systems with garages close to the network. Long deadhead routes (rural service, one garage serving a wide area) often push this to 1.4 or higher; high-frequency urban networks with garages on the line sometimes sit at 1.1.
- For per-route overrides, edit the route in the Routes panel — each route has a
cost_per_revenue_hourfield that supersedes the global default when set. Useful when one route is contracted out at a different rate. - Read the system summary card and the per-route table. Use the Export CSV button to drop the figures into a spreadsheet for a memo or for combining with non-GTFS cost categories.
Methodology
The tool computes these figures from the open feed:
- Revenue hours per service pattern: for every trip in
trips.txt, take the duration as the difference between the first and last stop time. Sum across all trips in eachcalendar.txtservice pattern. - Weekly revenue hours: revenue hours per service pattern, multiplied by the number of days that service runs in a typical week (the day-of-week toggles in
calendar.txt). - Annual revenue hours: the calendar range is walked day-by-day, applying
calendar_dates.txtexceptions, then normalized to a 365-day year. A calendar that covers six months will be doubled; a calendar that runs three years will be averaged down. - Total hours (platform hours): revenue hours × deadhead factor.
- Peak vehicles: a sweep-line over trip start and end times — the largest number of trips overlapping at any moment is the minimum vehicle count required to operate the schedule. (Strictly: it's the lower bound; the real number is a bit higher because of interlining inefficiency and the operator's own pull policies.)
- Cost: total hours × cost-per-revenue-hour. Weekly and annual figures are reported separately so you can quote whichever fits the audience.
What it doesn't capture
- Capital and overhead. The tool produces an operating cost only — no vehicle purchase, no garage, no overhead allocation. Add those separately in your budget memo.
- Time-of-day rates. The deadhead factor is a single multiplier, not a peak/off-peak split. Operators with split shifts and premium-pay rules will need to adjust the cost-per-hour figure to reflect their loaded blended rate.
- Mode-specific cost structures. Per-revenue-hour costing fits fixed-route bus cleanly and gets fuzzy for demand-responsive service (where per-revenue-mile or per-trip is often more meaningful). Use the tool's output for flex zones as a rough order of magnitude.
- Headway-based service. Frequencies defined in
frequencies.txtrather than as explicit trips are expanded against the headway and span to compute revenue hours. The resulting figure is an average — if the actual schedule has gaps that the headway doesn't, the cost will be slightly overstated.
Methodology references
- National Transit Database — the canonical source for per-agency, per-mode operating expense per vehicle-revenue-hour. Useful for picking a defensible cost-per-revenue-hour value when you don't have an internal number; pull the most recent year's Operating Expenses file and divide by Vehicle Revenue Hours for the closest peer agency in your mode.
- TCRP Synthesis 90: Transit Cost Allocation Models — background on how agencies build the multipliers (hourly, mileage, peak-vehicle) that underlie a serious cost model.
See also
- Service summary — revenue hours and trip counts without the cost calculation.
- Demographic coverage — pair with cost for a service-per-dollar-per-capita view.
- Timetables and trips — where the underlying revenue-hour data comes from.