
Demographic coverage Agency
Population, households, workers, jobs, and equity demographics within walking distance of your stops, tallied at the individual census-block level from US Census data. Per-route and system-wide figures suitable for a grant narrative ("33,600 residents and 32,000 jobs are within a quarter-mile of the network") or for sanity-checking a service alternative.
The system-level summary is free on every plan. The per-route coverage breakdown is an Agency feature.
What it is
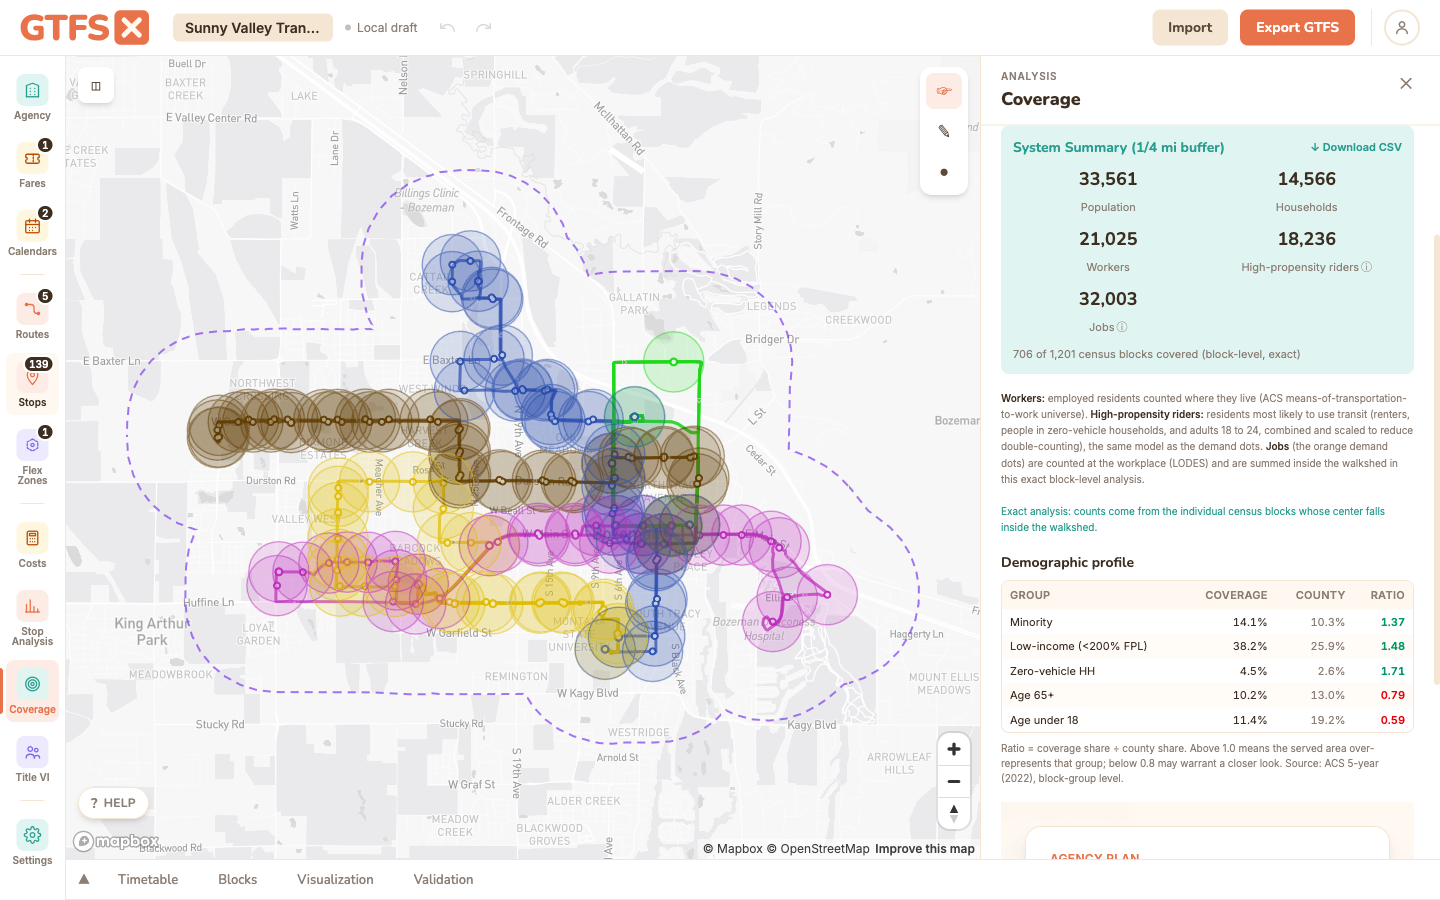
The Coverage panel reports, for the area within walking distance of your transit network: population, households, workers, high-propensity riders, and jobs. Alongside the totals it shows an equity profile (minority, low-income, zero-vehicle, senior, and youth shares) compared against the county baseline, and a Download CSV of every figure.
The counts are exact rather than approximate: GTFS·X tallies the individual US census blocks whose center falls inside the walkshed. Block population comes from the 2020 decennial count, American Community Survey demographics are apportioned down to each block by population, and jobs are workplace counts from the Census LEHD program. It works for any feed in the 50 states plus DC.
It answers the most-asked question in a service-planning meeting ("how many people does this route reach?") without firing up a desktop GIS or pulling Census tables by hand. Run it on your existing network to anchor a discussion, or on a proposed alternative to support a recommendation.
When to use it
- Grant applications. Most FTA discretionary programs (5310, 5311, 5339, Areas of Persistent Poverty, etc.) ask for population served. A defensible number with a documented methodology beats a hand-waved estimate every time.
- Service-planning workshops. Comparing two corridor options? Run coverage on both and put the numbers side by side. The conversation shifts from "I think A is better" to "A reaches 4,000 more households but 1,200 fewer jobs."
- NTD reporting context. Population in service area is one of the NTD reportable metrics; the Coverage figure is a defensible input.
- Title VI program updates. A baseline-coverage figure pairs naturally with the Title VI analysis — the latter is a ratio, the former is the denominator.
How to use it in GTFS·X
- Open the feed in the editor and click Coverage in the left sidebar.
- Click Analyze Coverage. GTFS·X loads the census blocks around your stops and tallies the ones inside the walkshed. The first run for a region takes a few seconds; results cache locally.
- Read the system summary: population, households, workers, high-propensity riders, and jobs, with the count of census blocks covered noted underneath.
- Below it, the demographic profile compares the covered area's equity shares against the county baseline (a ratio above 1.0 means the served area over-represents that group).
- Scroll the per-route breakdown to see how each route contributes, then use Download CSV to export every figure (system, county baseline, and per route) for a report. Pair a route's coverage with the Cost estimation panel for a service-per-dollar view.
- Agency-plan users can switch on street-network walksheds for walk-distance reach instead of a straight-line buffer.
Methodology
GTFS·X counts the individual US census blocks whose center point falls inside the walkshed, then sums each block's attributes. Counting real blocks rather than approximating with overlap math is what makes the figures exact.
- Walkshed. By default, a straight-line buffer around each stop: quarter-mile (1,320 ft) for bus, ferry, cable car, gondola, and funicular routes; half-mile (2,640 ft) for tram, subway, and rail. These match the conventional walking-distance assumptions used in transit-planning practice. Agency-plan users can switch to street-network walksheds, which follow the actual pedestrian network (and can size each stop's reach by its service frequency) instead of a circle.
- Census blocks, not block groups. A census block is the Bureau's smallest geography, often a single city block. GTFS·X loads a nationwide layer of every block's internal point and tallies the blocks inside the walkshed, so coverage tracks your stop placement closely instead of being smeared across a half-mile disc. (An earlier version of this tool approximated block groups as discs on tract centroids; the block-level method replaces it.)
- Data sources. Block geometry and 2020 population come from the Census TIGER/Line block file (TABBLOCK20). Demographic detail comes from the American Community Survey 5-year estimates (2022 release), published at the block-group level and apportioned down to each block in proportion to its 2020 population (a standard dasymetric step). Jobs come from the Census LEHD/LODES program, which already reports employment at the block level.
- What each figure measures. Population (ACS
B01003), households (occupied households, ACSB25044), and workers (employed residents counted where they live, ACSB08301) are residence-based. Jobs are workplace-based, from LODES. High-propensity riders estimates the residents most likely to use transit: renters, people in zero-vehicle households, and adults 18 to 24, combined and scaled to discount the overlap between those groups. The equity profile reports the minority, low-income, zero-vehicle, senior, and youth shares of the covered area against the surrounding county. - System vs. per-route. The system summary counts each block once even when several routes reach it (a union, not a sum). Per-route figures are pure per-route, so adding them up will over-count blocks served by more than one route.
- Coverage area. The exact block layer spans the 50 states plus DC. A feed outside that (a US territory, or outside the country) automatically falls back to the older block-group estimate, and the panel labels which method produced each figure.
Limits
- The default straight-line buffer treats stop placement as the unit of access; it doesn't model walk-network geometry, intersections, or topography. A stop on the wrong side of a freeway with no underpass still counts as covering everything within the buffer. The Agency-plan street-network walkshed addresses this by following the real pedestrian network.
- ACS demographics are apportioned to blocks in proportion to each block's population, which assumes they're distributed evenly within a block group. This is far more accurate than a land-area split, but it remains an estimate at the block level for everything except the raw population and job counts (which are measured directly).
- "Workers" and "jobs" measure different things and are both reported: workers are employed residents counted where they live; jobs are counted where the work is (so a downtown with few residents but many jobs shows a low worker count and a high job count).
- Figures use the ACS 2022 5-year vintage and 2020 decennial block geometry. If your agency's adopted methodology requires a different vintage, cite the one used in any document.
- The on-screen equity profile is a quick coverage-vs-county comparison. For a formal Title VI service-equity analysis (disparate-impact and disproportionate-burden tests), see the Title VI analysis page.
See also
- Title VI analysis — equity comparison using the same Census plumbing.
- Rider propensity — demographic-driven heatmap including workplace data.
- Cost estimation — pair with coverage for a service-per-dollar-per-capita view.